

Manisha Modi
Content Strategist & Writer
What Is Cost-Per-Hire and How Do You Actually Reduce It?
Every recruiting team can tell you what they spent on a job board last month. Almost none can tell you what a single hire actually cost. Because that number is hiding in four different places: an invoice, a recruiter’s calendar, a hiring manager’s Slack thread about “just one more interview,” and a headcount plan that assumed the role would be filled six weeks ago.
Cost-per-hire is the metric that drags all of that into one place, and by most public benchmarking, it’s quietly climbing every year even as the tools to lower it get better. This guide covers what cost-per-hire measures, what it costs in 2026 by role, industry, and geography (India included), where most companies get the number wrong, and the specific levers that bring it down, including where a platform like Flashfox removes entire cost buckets instead of just shaving them.
What Is Cost-Per-Hire?
Cost-per-hire (CPH) is the total amount an organization spends to fill one open position, averaged across all hires in a given period. It’s the standard metric HR and talent acquisition teams use to measure recruiting efficiency, plan budgets, and benchmark against competitors.
The formula was standardized in 2012 by the Society for Human Resource Management (SHRM) and the American National Standards Institute (ANSI), and it’s still the industry-accepted way to calculate it:
Cost-Per-Hire = (Total Internal Recruiting Costs + Total External Recruiting Costs) ÷ Total Number of Hires
- Internal costs: recruiter and hiring-manager salaries (prorated to hiring time), interview panel hours, referral bonuses, ATS and recruiting software subscriptions.
- External costs: job board and LinkedIn Recruiter fees, agency commissions, background checks and assessments, advertising, candidate travel, and employer-branding spend.
The formula looks simple. In practice, most companies get it wrong, either by undercounting (only tracking invoices) or by comparing themselves to a benchmark that isn’t measuring the same thing.
Why Cost-Per-Hire Is More Than an HR Number
CPH isn’t a vanity metric. It’s one of the few recruiting numbers that maps directly to the P&L. A Paychex 2026 Business Leaders Priorities survey found cost-per-hire is the single most-tracked HR metric among small and mid-sized businesses, cited by 47% of companies with 5-19 employees and 54% with 20-49 employees, ahead of time-to-fill and turnover.
It matters because it’s a budgeting input you can’t skip; it exposes process inefficiency (a rising CPH with no improvement in candidate quality usually means a broken funnel, not a tougher market), and it’s comparable across sourcing channels. Once you know your CPH by referral vs. job board vs. agency, you know exactly where to reallocate the budget. It’s also not the only number that matters: CPH has to be read next to quality-of-hire and retention, since cutting corners to lower it shows up later as attrition, covered in depth in the real cost of manual recruiting.
Cost-Per-Hire Benchmarks in 2026
Here’s the confusing part: there isn’t one current SHRM figure. There are two, from two different reports, measuring two different things, and both are legitimate.
SHRM’s 2026 Recruiting Executives Benchmarking report (4,657 respondents surveyed November 2025-January 2026) reports the median cost-per-hire:
| Position Type | 2026 median CPH | 2025 median CPH | Change |
| Non-executive roles | $1,300 | $1,200 | +8% |
| Executive roles | $15,000 | $10,600 | +42% |
SHRM’s separate 2025 Benchmarking Report reports the average, which is pulled up by expensive outlier searches (specialist, executive, and hard-to-fill roles) in a way the median isn’t:
| Position Type | Average CPH |
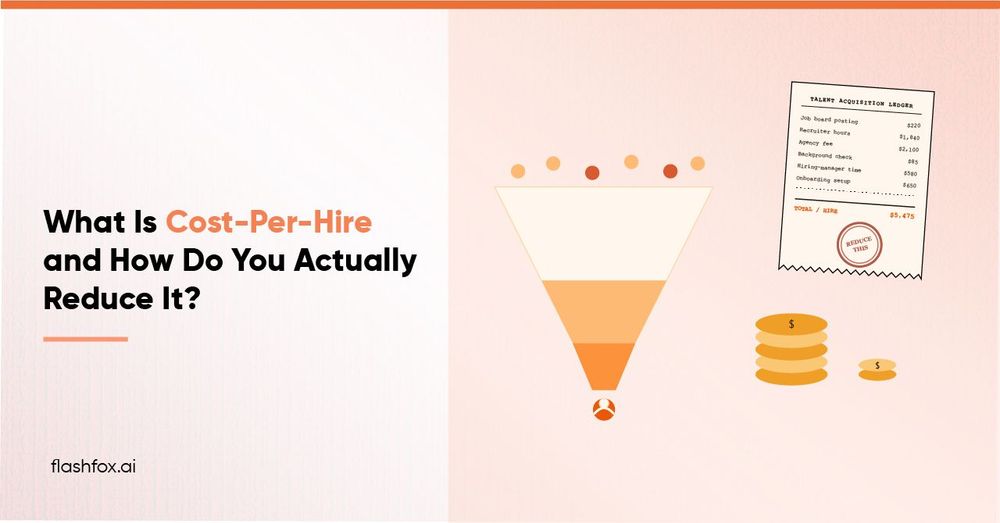
| Non-executive roles | $5,475 |
| Executive roles | $35,879 |
The takeaway is that high-volume employers hiring mostly entry- and mid-level roles should benchmark against the median ($1,300). A mix with senior or specialist roles should expect a true average much closer to or above $5,475.
By US industry (average CPH, non-executive roles), technology and finance run well above the cross-industry figure, while high-volume retail runs below it:
| Industry | Approx. average CPH |
| Technology | ~$6,200 |
| Finance | ~$5,900 |
| Healthcare | ~$4,700 |
| Retail | ~$2,700 |
In India, the absolute numbers differ, but the direction doesn’t. Standard-role cost-per-hire typically runs ₹25,000-₹70,000, scaling into the lakhs for niche tech and leadership searches, with average time-to-hire around 35-45 days. Indian hiring volume is rising fast. Naukri’s JobSpeak index recorded 8% white-collar hiring growth in FY26, the strongest in three years, and ManpowerGroup’s Q2 2026 Net Employment Outlook for India hit a record 68%. More demand on the same manual processes is exactly what pushes cost-per-hire up.
What Actually Goes Into Your Number (And What Most Teams Miss)
Based on Aptitude Research and SHRM’s cost-component benchmarking, here’s roughly where recruiting spend goes:
| Cost bucket | Share of total CPH | What’s often missed |
| Recruiting and hiring-manager labour | ~45% | Interview panel hours, coordination time |
| Sourcing channels (job boards, LinkedIn) | ~20% | Boards paid for but never yielding a hire |
| Recruiting technology (ATS, scheduling, scoring) | ~15% | Licenses paid for underused seats |
| Background checks & assessments | ~10% | Per-candidate cost multiplied by rejected candidates too |
| Employer brand, careers page, candidate experience | ~10% | Content and design time, rarely tracked as a recruiting cost |
Recruiter and hiring-manager labour is the single biggest line, and the one most often left off the spreadsheet, since no invoice is generated for it. Teams that only tally job-board and agency invoices report a CPH a fraction of the real number; add labour and internal tooling, and it’s frequently two to three times higher.
A Worked Example
Say a mid-sized company hires 25 people in a quarter and wants its real CPH.
| Particulars | Line item | Cost |
| External | Job boards + LinkedIn Recruiter | $6,000 |
| Agency fees (3 specialist hires) | $10,500 | |
| Background checks/assessments (25 x $150) | $3,750 | |
| Candidate travel | $1,250 | |
| External total | $21,500 | |
| Internal | Recruiter time (2 recruiters, 60% of quarter) | $22,500 |
| Hiring manager/panel time (25 x 4 hrs x $75/hr) | $7,500 | |
| ATS/recruiting tech (prorated) | $2,500 | |
| Internal total | $32,500 | |
| Total cost | $54,000 ÷ 25 hires | $2,160 CPH |
That number sits comfortably inside the SHRM range, but internal labour ($32,500) outweighs every external invoice combined ($21,500). That’s the pattern almost every 2026 benchmark converges on. It’s why automating the labour-heavy stages like screening, scheduling, and first-round assessment moves CPH more than negotiating a job-board discount ever will.
Why Cost-Per-Hire Keeps Climbing
Three forces are pushing the number up across almost every benchmark cited above:
- Vacancy cost compounds while roles stay open. SHRM puts median time-to-fill at 44 days; Employ’s 2026 Recruiting Benchmarks Report shows it easing from 67.7 days (2025) to 63.5 days (2026), still well above the point where an open seat stops costing lost output.
- A single bad hire wipes out any savings from a “cheap” process. The U.S. Department of Labor estimates a bad hire costs roughly 30% of first-year salary; CareerBuilder puts the average bad-hire cost near $14,900, often more than the entire screening budget that produced the hire. More on this in the real cost of manual recruiting.
- Tool sprawl adds cost without adding speed. Separate subscriptions for sourcing, screening, scheduling, and assessments each carry a license fee and an integration tax, covered further in how Flashfox replaces a fragmented sourcing and screening stack.
How to Actually Reduce Cost-Per-Hire
None of the effective levers involve spending less on people. They involve removing the manual, repetitive steps that quietly account for nearly half the total cost.
1. Turn on employee referrals and treat them as a channel, not a favour
Referrals remain the highest-ROI source in every dataset that tracks source of hire. Jobvite’s long-running benchmark shows referrals make up only about 7% of applicants but roughly 40% of actual hires. A Pinpoint analysis of 4.5 million applications found referred candidates are 7x more likely to be hired than job-board applicants, move through the process 11% faster, and can lower cost-per-hire by up to 40%. LinkedIn data shows referral hires also retain at meaningfully higher rates, lowering CPH again down the line by avoiding a repeat search.
2. Automate resume screening
Manual screening is where recruiter hours disappear fastest. At roughly 6-7 seconds of attention per resume across 250 applications for a single role, screening alone can consume 25+ hours per hire. Aptitude Research found 65% of companies using AI in hiring reported an improved cost-per-hire, versus 39% of companies not using AI. This is the clearest direct link between automation and a lower number.
3. Cut interview rounds, not interview quality
A four-person panel, 45 minutes each plus 15 minutes of feedback, at a $75/hour blended rate, runs about $300 per candidate, before that candidate has even received an offer. Multiply that across a four- or five-round process and “being thorough” gets expensive fast. Moving to two or three structured rounds with a defined scorecard cuts that spend without cutting rigour.
4. Rediscover candidates already in your ATS
Every closed requisition leaves behind screened, qualified candidates who weren’t right for that specific role. Re-engaging them for a new opening costs a fraction of a fresh sourcing campaign and skips the top-of-funnel entirely.
5. Fix job intake before you fix sourcing
A large share of CPH waste traces back to unclear role requirements at the start: mismatched candidates, wasted interviews, reopened searches. A tighter intake conversation up front is free and prevents the most expensive kind of rework. Starting over.
6. Improve offer-acceptance rate
Every declined offer means restarting the funnel from a later, costlier stage. Faster communication and market-accurate compensation benchmarking close this leak, and it compounds over any hiring plan of real size.
7. Consolidate your recruiting tech stack
Separate subscriptions for sourcing, screening, scheduling, and assessments each add license cost. More expensively, the recruiter hours spent moving data between systems that don’t align with each other, a problem our guide to the best AI recruiting tools in 2026 breaks down further.
8. Track CPH by channel, quarterly
You can’t fix what you don’t segment. Tracking CPH separately for referrals, job boards, and agency hires every quarter is the only way to see which channel’s “cheap” hires are actually cheap once labour is included.
Where Flashfox Fits In
Most of the cost buckets above, including manual screening hours, interview coordination, and disconnected point solutions, exist because hiring is split across five or six tools that don’t share data. Flashfox is built to close that gap for sourcing, AI-driven screening, and candidate coordination in one platform instead of one subscription per pipeline per stage. See the 6 stages of AI-powered hiring and how Flashfox replaces a fragmented sourcing and screening stack for how that consolidation plays out stage by stage.
The direction of the effect is well established. Organizations using AI in hiring report better cost-per-hire outcomes at nearly double the rate of those that don’t. The size of that effect for your specific hiring volume and process is worth measuring directly; the audit is worth running before and after adopting any new tool, Flashfox included.
The Real Question Isn’t “How Much Did We Spend?”
It’s “where did that money actually go, and would we spend it the same way again?” Most organizations can answer the first from an invoice. Almost none can answer the second without adding up recruiter hours, panel time, and the tools nobody remembers signing up for.
Cost-per-hire, done properly, isn’t a number you report once a year and forget. It’s what tells you, hiring by hiring, whether your process is getting sharper or just getting more expensive. Get the formula right, benchmark it against the figure that matches your hiring mix, and fix the funnel stage that’s actually bleeding money, not the one that’s easiest to blame.
Frequently Asked Questions
Comments (0)
Leave a comment